
Benchmarking
The Employee Engagement Benchmarks Q4 2025
Gain valuable insights for measuring your team’s engagement levels, drivers, and eNPS trends with our benchmark data – collated from over 500,000 employee responses from various industries and organisations. This data is from October to December 2025 (Q4 2025) and focuses on employee responses from UK-based organisations of various sizes and from a wide range of sectors.
Enter your email address below to subscribe to our quarterly benchmarking emails:

See the latest benchmarking results for your industry
See how similar sized organisations are doing
Benchmarks at a glance
In a hurry? Check out this short overview video which runs through all of the key findings in this Q4’s Employee Engagement Benchmarks.
In this video you’ll get the latest on eNPS, Engagement Index, and response rates.
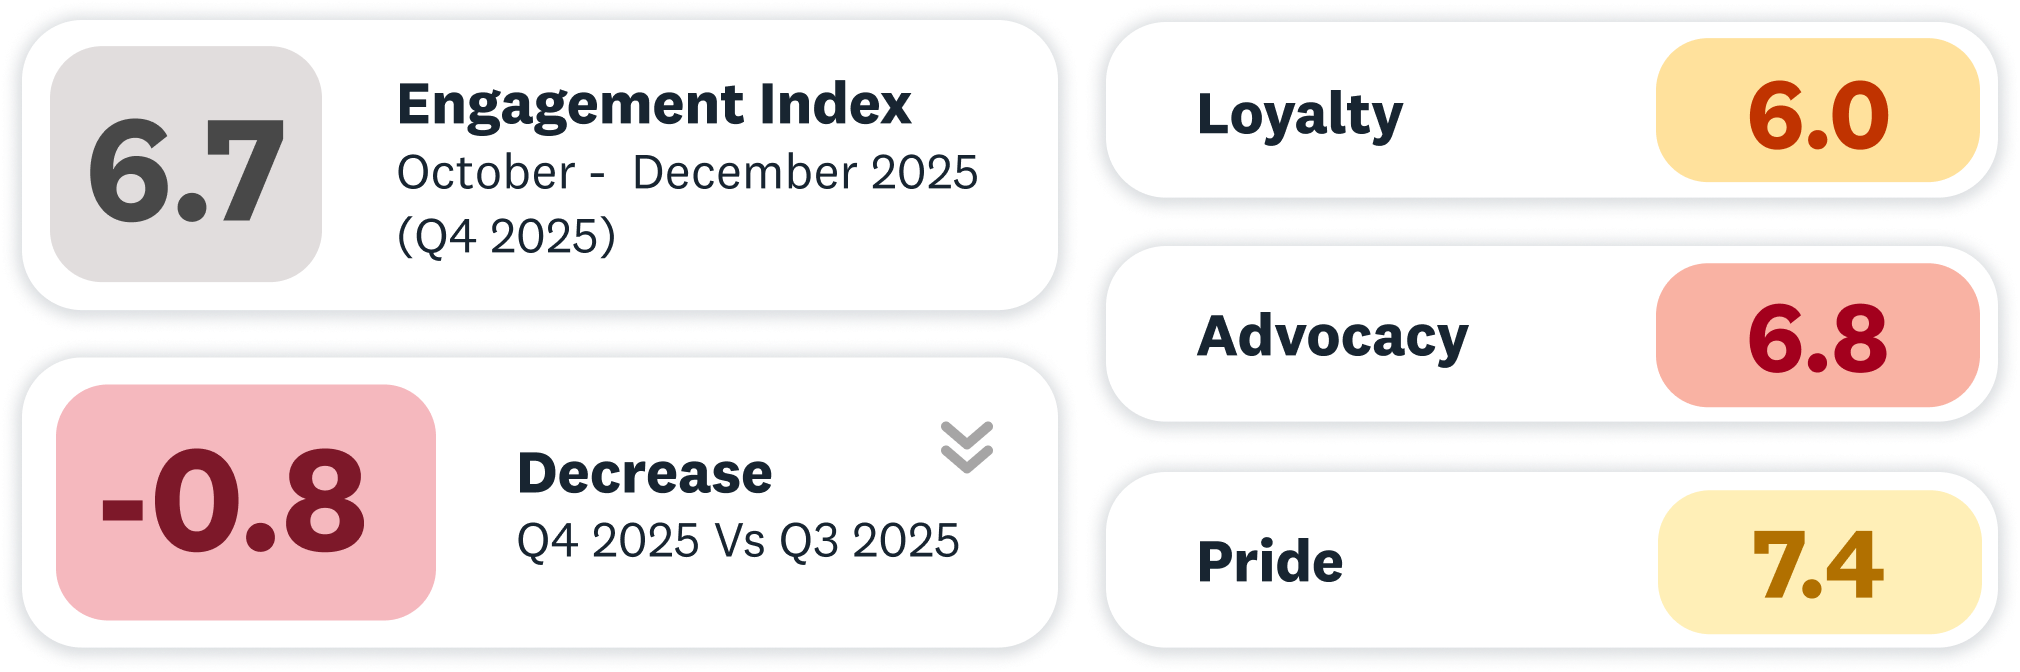
Engagement Index
Hive’s Engagement Index is made up of the responses to 3 core questions measuring Loyalty, Advocacy and Pride across an organisation (measured on a scale of 0 to 10 with a result of 7 and above indicating a positive score).
Compare your organisation’s Engagement Index against the benchmark to get a snapshot of how your employees are feeling.
Not sure what your score is? We can help.


Engagement Index analysis from Jen Southern,
Head of Professional Services
The Engagement Index for Q4 2025 sits at 6.7, down from 7.5 in Q3 and the lowest level recorded in our benchmark history. This is not just a headline shift. The underlying measures show a clear softening in how people are feeling about their organisation as the year closes. Loyalty has fallen to 6.0, Advocacy to 6.8, and Pride has dropped from 8.1 to 7.4.
For HR leaders, this matters because these measures tend to move before outcomes do. A fall in Loyalty is often one of the earliest signals of increased turnover risk. Declines in Advocacy and Pride suggest that confidence in the organisation and emotional connection to it are weakening. Even if people stay, this combination can show up later as pressure on performance, productivity or wellbeing.
This is where employee voice earns its keep. The Engagement Index is not a judgement, it is an early warning system. It tells you where to look and where to act before issues harden into attrition, disengagement or absence.

The most effective responses at this point are focused and evidence-led:
- Diagnose before reacting
Use your voice data to understand where the decline is most pronounced. Is it concentrated in particular teams, roles or parts of the organisation? The aim is not a universal response, but targeted action where engagement is softening fastest. - Prioritise retention signals
A dip in Loyalty should prompt sharper attention on career conversations, recognition and manager capability. This is about protecting your critical workforce before resignation becomes behaviour rather than sentiment. - Support sustainable performance
Where Pride and Advocacy are slipping, people may be staying but struggling. Clear priorities, realistic workloads and visible support for wellbeing can stabilise performance and prevent further erosion. - Close the loop visibly
When people see that their feedback leads to real decisions and action, confidence rebuilds. Closing the loop is one of the most effective levers for restoring both Advocacy and Pride.
Taken together, the Q4 benchmark points to a moment of choice. The overall dip may appear modest, but the underlying signals are meaningful. Acting early, using employee voice to focus effort, and being explicit about what you are changing as a result will put you in a stronger position as you head into 2026. For HR leaders, this is less about fixing engagement and more about strengthening organisational resilience while there is still time to do so.
Looking across the quarter, while Engagement Index scores by industry appear relatively stable, it’s worth noting that the overall Engagement Index and its drivers are at their lowest or joint-lowest levels recorded, meaning even modest declines at sector level may signal growing pressure rather than normal seasonal fluctuation. Which is something organisations need to be mindful of.
Technology continues to lead engagement, holding steady at 7.9, just below its summer high of 8.0. This mirrors strong eNPS performance, suggesting employees are motivated, aligned, and resilient to year-end pressures — a position many sectors struggle to sustain.
Health shows one of the clearest improvements, rising from 7.4 over the summer to 7.7 from October through December. This aligns with the eNPS uplift seen during the same period, indicating that advocacy gains are supported by genuinely stronger day-to-day experience, not just temporary sentiment shifts.
Housing Associations remain highly engaged overall, but Q4 shows a subtle decline: engagement peaks at 7.7 between September and November before dipping to 7.6 in December. This mirrors a slight drop in eNPS from 31 to 28, likely reflecting cumulative pressures from regulatory demands, service delivery, and year-end fatigue rather than sudden disengagement.
At the lower end, Education and Government continue to record the lowest engagement scores, with Education at 6.7 and Government at 6.6. The lack of improvement suggests ongoing structural challenges, such as workload, resourcing, and confidence in long-term organisational direction, that cannot be resolved through short-term initiatives alone.
Construction, Manufacturing, and Professional Services sit in the middle range. Engagement remains generally stable but shows small fluctuations, reflecting sensitivity to delivery pressures and seasonal workload peaks.
For HR Directors and Managers, the key takeaway is that headline stability can mask emerging pressure points. Even small dips in engagement, particularly in sectors like Housing Associations and Professional Services, can precede changes in retention, absence, or performance. Leaders should use this data alongside employee feedback to pinpoint where targeted interventions, such as manager support, recognition initiatives, or workload adjustments, are most needed in 2026.
Q4 engagement also varies by organisation size, highlighting how scale influences employee experience.
Smaller organisations (0–250 employees) consistently hold the highest engagement at 7.4, reflecting strong connection, motivation, and alignment across small teams. Close visibility of leadership, direct communication, and employees’ ability to see the impact of their work likely help sustain this engagement, even during year-end pressures.
Mid-sized organisations (251–500 employees) and (501-1,000) show relatively stable scores, mostly between 7.2 and 7.3, though there is slight decline for the (500-1,000) group toward December. Maintaining engagement here can be more challenging as teams grow and layers of management increase, highlighting the importance of consistent communication and targeted support.
Very large organisations (5,001+ employees) remain at the lowest engagement levels, at 6.7, down slightly from 6.8 over the summer. Structural challenges such as limited leadership visibility, slower communication flows, and complexity of scale may subtly depress engagement, even if employees remain committed to their day-to-day roles.
These patterns suggest that engagement is not simply about absolute scores but about how organisations adapt to scale, maintain connection, and support employees under pressure. HR leaders in larger organisations may need to focus on interventions that improve visibility, recognition, and connection, while smaller organisations can maintain engagement with relatively fewer adjustments.
Survey Response Rates
Survey response rates provide important context for how confident employees feel sharing their views, and the Q4 data shows clear variation across industries.
At Hive, we typically recommend a minimum survey participation rate of 75% for results to be considered truly representative and meaningful. Against this benchmark, only Entertainment and Recreation (79%) consistently exceeds this threshold. Notably, this represents a significant increase from 43% last quarter, suggesting a meaningful shift in employee willingness to take part. While the data can’t point to a single cause, this level of improvement often reflects positive changes like greater confidence that their feedback will be heard and acted upon. It points to a strengthening culture of participation, where employees feel safer and motivated to speak up.
Construction and Heavy Industry (71%) and Health (70%) sit just below the recommended level. While these response rates still provide useful insight, they also indicate an opportunity to strengthen participation further. In operationally demanding environments, timing, clarity of purpose, and visible follow-up can make the difference between good and genuinely representative response levels.
In Health, the Q4 figure represents a substantial increase from 12% last quarter, making them one of the most improved across all industries. While multiple factors are likely at play, this shift suggests growing confidence among employees to share their views. This rise in participation also aligns closely with the uplift in eNPS seen from October onwards, reinforcing the link between employee confidence, willingness to speak up, and improved advocacy.
A broader mid-range group includes Manufacturing (63%), Housing Associations (58%), Hospitality (57%), Creative and Media (57%), and Nonprofit (55%). These response rates suggest that while many employees are willing to share feedback, a significant proportion remain unheard. In these sectors, competing priorities, workload, and confidence in follow-up can all influence participation, making it especially important to demonstrate how feedback informs decisions and action.
At the lower end, Technology (52%), Government (48%), Professional Services (47%), and Education (41%) record response rates well below the recommended threshold. In these industries, lower participation may reflect survey fatigue, time pressure, or scepticism about whether feedback leads to meaningful change. Notably, these sectors also tend to show lower or more variable engagement and advocacy scores, highlighting the link between employee sentiment and willingness to speak up.
Q4 response rate data reinforces that participation is not just a metric, but a signal of trust and confidence. For HR Directors and Managers, the priority is understanding where participation falls below meaningful levels and addressing the underlying causes, whether that’s survey timing, communication, or follow-up, to ensure employee insight genuinely reflects the full workforce as organisations head into 2026.
Survey response rates by organisation size show a clear pattern across Q4, with participation generally higher in smaller organisations and gradually declining as organisation size increases.
When viewed against Hive’s recommended 75% participation rate for meaningful insight, response rates across all organisation sizes fall below the threshold. This doesn’t mean the data isn’t useful, but it does suggest that some employee voices may be underrepresented, particularly in larger organisations.
Smaller organisations (0–250 employees) see meaningful improvement in participation from 57% in Q3 to 64% in Q4. This increase suggests renewed engagement with surveys toward year-end. This could be that the Q3 surveys we followed up with clear communication and actionable next steps, giving people more confidence in organisational surveys, and a want to participate.
Organisations with 251–500 employees remain relatively stable at 65%. While participation is stronger here than in many larger organisations, it still falls short of the recommended level, indicating an opportunity to strengthen confidence in surveys. This can be done by showing change happens when feedback is given, creating a culture of psychological safety, and making feedback part of the everyday culture.
Participation drops among mid-sized organisations (501–1,000 employees) from 71% to 51%. This represents one of the biggest declines across all size groups and mirrors the changes we’ve seen in eNPS for this organisation size. It could be that year-end workload and motivation have impacted participation, or deeper issues like reduced visibility of action have discouraged end of year feedback.
A modest increase in response rates came from 1,001–5,000 employee organisations at 48% up from 37%. As organisations grow, it can be increasingly difficult to engage employees at this scale, which makes this increase impressive. It suggests that clearer communication, better-timed surveys, or the experience organisations are providing are re-engaging employees to participate in giving feedback, even with year-end pressures.
At the top end, very large organisations (5,001+ employees) experience the most dramatic change, falling from 82% in Q3 to 42% in Q4. This sharp drop highlights how participation in very large workforces can be highly sensitive to timeline, competing priorities, and perceived relevance.
Taken together, the Q4 response rate data shows that survey participation is not static, and can shift quickly depending on context, timing, and employee confidence. What organisations can do is focus on understanding why participation has changed quarter-on-quarter, identifying which groups are disengaging from surveys, and reinforcing the link between employee feedback and visible action. Doing so will be key to building more consistent and representative insights in the future.
employee Net Promoter Score (eNPS)
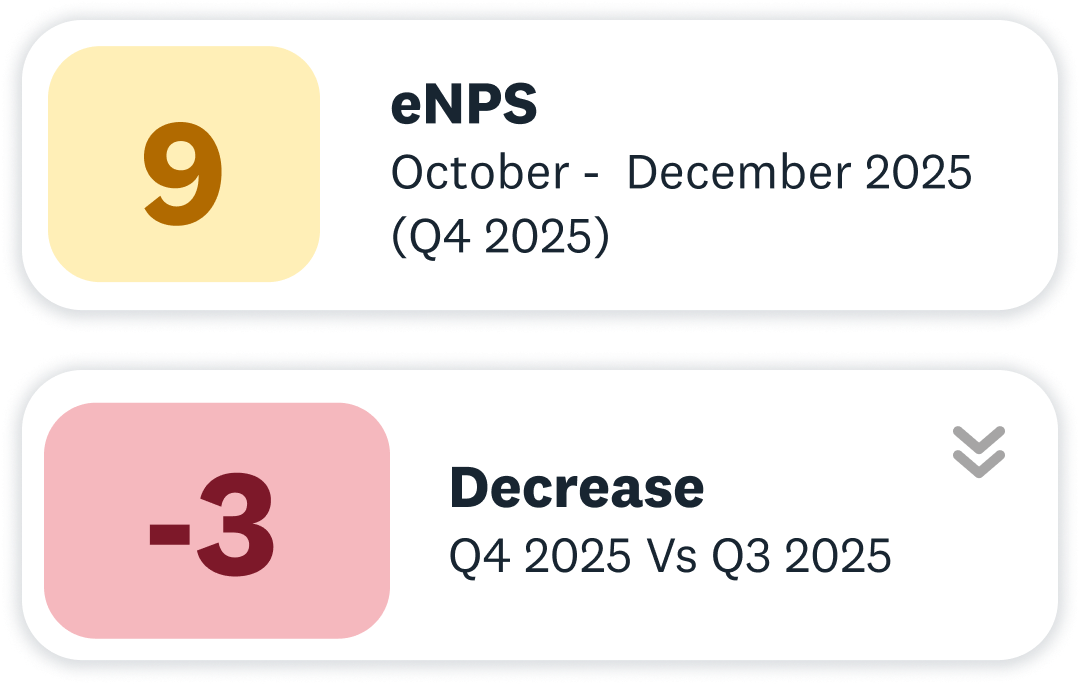
October - December 2025
(Q4 2025)
Employee Net Promoter Score (eNPS) is an internationally recognised measure of engagement using the question ‘How likely are you to recommend our organisation as a good place to work?’ with detractors, passives and promoters. A positive score means an organisation has more advocates (promoters) than it does detractors. It is measured on a -100 to +100 scale.
What does a good eNPS score look like?
+41 and above is outstanding
+21 to +40 is very good
-10 to +20 is a typical score
-11 and below is a low, concerning score.
Q4 eNPS scores continue to tell a familiar but important story for HR leaders: employee advocacy remains highly uneven across industries, with some sectors building steady momentum while others are struggling to shift long-standing sentiment.
Technology remains the strongest-performing sector throughout Q4, consistently recording eNPS scores in the low–mid 30s. These results suggest relatively high levels of employee confidence and willingness to recommend their organisation as a place to work — often supported by clearer role expectations, stronger employer propositions, and greater flexibility during peak periods.
A notable shift this quarter is seen in Health, where eNPS rises from 20 during the summer months to 30 from October onwards, remaining stable through to December. This improvement may reflect better workforce stabilisation after summer pressures, alongside clearer communication and targeted support initiatives as organisations prepare for winter demand. Where improvements are informed by employee insight, the impact appears more sustained.
Housing Associations continue to show a steady upward trend across the year, peaking at 31 in October before settling at 28 in December. While the movement is gradual, it is significant in a sector facing ongoing regulatory change, service demand, and cost pressures. This suggests that consistent focus on internal experience, even in complex operating environments, can positively influence employee advocacy over time.
At the lower end of the scale, Education and Government remain in negative eNPS territory throughout Q4. Although there are small month-on-month improvements, scores indicate continued challenges around morale, workload, and confidence in organisational direction. These results point to deeper, systemic issues that are less likely to shift without long-term workforce planning and sustained organisational change.
Elsewhere, Construction, Manufacturing, and Professional Services show relatively stable but modest eNPS scores. Minor fluctuations across Q4 may reflect year-end fatigue, delivery pressures, or uncertainty heading into the new year. In these sectors, advocacy appears more sensitive to short-term pressures.
A particularly striking decline is seen in the Nonprofit sector, where eNPS drops sharply from 14 in September to 4 in December — the largest drop-off across all industries. This suggests that employees in this sector may be experiencing compounding pressures toward year-end, such as resource constraints, high service demand, or organisational uncertainty, which are eroding advocacy quickly. This reinforces the importance of combining structural support with employee insight to stabilise morale and confidence.
So what is the data for Q4 eNPS telling us? Well, these benchmarks reinforce that eNPS is shaped by a combination of sector context, workload pressure, leadership visibility, and organisational follow-up. While listening to employee feedback can support improvement, acting on it will play a significant role in shaping advocacy levels.
eNPS scores by organisation size continue to highlight how scale shapes employee advocacy.
Small organisations (0–250 employees) consistently lead, holding steady around 21 throughout Q4. Employees in these teams not only remain engaged in their daily work but also retain strong confidence in their organisation. Close communication, visible leadership, and the ability to see the impact of their contributions help sustain high advocacy, even under year-end pressures.
Mid-sized organisations show more variability, and breaking this group down reveals important nuances:
251–500 employees start relatively modest, ranging from 5 to 7, with a slight dip toward year-end. Advocacy in these smaller mid-sized teams appears sensitive to operational pressures and leadership visibility, suggesting that even small interventions, such as following up on employee feedback or providing recognition, can help stabilise scores.
501–1,000 employees peak at 17 in September, but drop sharply to 10 by December, representing the largest swing among all mid-sized groups. This highlights both the potential impact of targeted initiatives and the fragility of advocacy in organisations of this size, where workload and communication gaps can quickly erode confidence.
1,001–5,000 employees show a similar pattern, peaking at 14 in October before falling to 9 by December. This group demonstrates that even relatively high engagement in the mid-year can be vulnerable to year-end pressures, complexity of scale, and operational demands.
Very large organisations (5,001+ employees) remain consistently low, plateauing at 8 throughout Q4. These organisations face structural challenges in maintaining high advocacy, with employees often feeling distant from leadership or slower to see the impact of organisational decisions. Even small dips in this group can significantly affect overall eNPS, particularly at year-end.
Across all sizes, these benchmarks highlight the importance of tailoring engagement and advocacy strategies to organisation scale. Smaller organisations can often sustain high eNPS with relatively minor interventions, while mid-sized and large organisations require more deliberate approaches, including visible leadership, structured feedback loops, and targeted recognition initiatives. Monitoring trends over time is critical for HR leaders to anticipate retention and engagement risks and take proactive action heading into 2026.

Keep your finger on the pulse
Receive our future benchmarking newsletter featuring key data and expert commentary delivered straight to your inbox
Enter your email address below to subscribe to our quarterly benchmarking emails:
